

Sustainability | Action Areas
Action Areas
Page Sections
Energy
Because purchased electricity and other sources of energy production account for more than 60% of UNCG’s greenhouse gas emissions, it’s critical that the university implement initiatives that increase energy efficiency in existing and future buildings. Likewise, it’s important that everyone in our campus community takes responsibility for their personal energy use in their offices, classrooms, and dorms. 25,000 people making eco-conscientious decisions, like turning off lights, computers, projectors, and TVs when not in use and complying with UNCG’s Standards of Comfort, all help reduce UNCG’s greenhouse gas emissions.
Grounds
UNCG’s picturesque campus includes more than 27 academic buildings and 30 residence buildings on 250-plus acres, many of which are designated green spaces. In 2021, the University earned a Tree Campus Higher Education designation for the 12th year in a row from the Arbor Day Foundation. Tree Campus is a program which honors colleges and universities and their leaders for promoting healthy trees and engaging students and staff in the spirit of conservation.
From the picturesque Foust Park, which has been part of the campus since it first opened in 1892, to Peabody Park, a 34-acre tract of mixed hardwood forest, to our numerous gardens, the green spaces on campus serve as a vital refuge for a wide variety of flora and fauna characteristic of the Piedmont region and as pleasant places for repose and retreat for our students, faculty, staff, and visitors.
Across campus, our Grounds crew prioritizes pollinator-friendly plantings to encourage and support populations of honeybees, butterflies, hummingbirds, etc., which are also essential to agricultural food production. Likewise, plant selection for turf, shrubs, and trees is targeted for drought tolerance, which reduces maintenance costs, dependence on irrigation, fertilizers, and replanting.
Bee Campus USA
UNC Greensboro is proud to be recognized as a Bee Campus USA by the Xeres Society for Invertebrate Conservation. Bee Campus USA provides a framework for university and college campus communities to work together to conserve native pollinators by increasing the abundance of native plants, providing nest sites, and reducing the use of pesticides.
UNC Greensboro’s participation is a collaboration between the Department of Biology, the Office of Sustainability, and the Facilities Grounds Department. The University has over 100 faculty who conduct sustainability-related research and offer over 350 courses with a sustainability-related outcome. In particular, the Department of Biology, which leads this charge, educates the next generation of scientists whose research ranges from understanding cell motility, cancer, and obesity, to ecological understanding of urbanization, disease ecology, climate change, and the fate of nutrients in streams.
Additionally, the department recently established a new Plant and Pollinator Center (PPC) which is a research, teaching, and community outreach facility. The PPC is a center for integrated research, student training, and public education/community engagement. While the PPC is part of the Department of Biology, it also serves as a center for collaborative research across UNCG departments and with other institutions. Research at the PPC addresses global issues of food security, growing an agricultural economy, and environmental sustainability.
Basic and applied sciences among closely collaborating scientists focusing on both plants and pollinators help us understand the connections in nature that underpin human health and wellness, the foods we eat, and environment in which we live. Impacts of research and education at the PPC center are local, regional, statewide, and worldwide.
Our participation in the Bee Campus USA initiative is a natural extension of our shared missions.
Other Initiatives
- Rainwater collection and storage systems.
- Smart electronic irrigation systems that use “rain-stop” devices to prevent watering in the rain.
- Underground and drip irrigation systems that are more efficient.
- Organic or slow-release fertilizers used for less frequent applications, decreasing labor and fuel costs.
- Removal of invasive species (English Ivy and Bush Honeysuckle) from Peabody Park.
- No harmful mowing of stream banks to reduce erosion and promote healthy water ecosystems.
- Fuel-efficient, biodiesel mulching mowers are chosen for purchase because mulched grass clippings that remain on turf reduce the need for fertilizers and irrigation.
- When necessary, trees and leaves are chipped into mulch for use on campus.
Additional Resources
Greenhouse Gases
This dashboard tracks the anthropogenic greenhouse gas emissions, and their sources, for the University of North Carolina at Greensboro’s main campus. It provides details concerning the trend of UNCG’s greenhouse gas emissions dating back to 2009, the year UNCG first conducted an inventory, and helps us measure our progress in reducing them – a goal stated in the University of North Carolina System’s Sustainability Policy.
For FY25, UNCG’s carbon footprint was 69,137 MTeCO2 which is a 14% reduction from our baseline FY09 footprint of 80,350 MTeCO2. This represents a 4% increase from our FY24 footprint.
The major contributors to the University’s emissions are: the electricity we consume from the Duke Energy Carolina’s utility grid (Scope 2); the natural gas and other fuels we burn on campus to heat our buildings and water, and to power our vehicle fleet (Scope 1); and the emissions generated by faculty, staff, and students commuting to and from campus (Scope 3).
More key statistics, data, and infographics from our FY23 report are provided in this webinar published on YouTube. More information regarding recent resource conservation projects on campus can be found in the 2023 Strategic Energy Plan report. More information regarding the future integration of sustainability initiatives on campus can be found in the 2020 Campus Plan.
The full FY09-21 Greenhouse Gas Inventory Report provides more details concerning next steps relating to the 19% increase in UNCG’s Scope 1 emissions since 2009, the importance of more participation in the UNCG Commuter Survey, and the impact of weather on our carbon emissions.
The full FY09-18 Greenhouse Gas Inventory Report provides more details concerning the calculation methods used in the Sustainability Indicator Management and Analysis Platform (SIMAP) developed by the Sustainability Institute at the University of New Hampshire. For more information about the Greenhouse Effect and the processes of Global Warming and Climate Change, please read UNCG’s original Greenhouse Gas Inventory conducted for the fiscal year 2009.
Additional Resources
Materials Management
Myriad products are consumed by the UNCG campus community on a daily basis. Disposal of these materials has financial, social, and environmental costs. Greenhouse gases, other pollutants, and waste are generated during every phase of an object’s lifespan, from the energy expended to extract resources, to their manufacture and transport, and eventually to their disposal. Our greenhouse gas inventories reveal that just the paper purchased annually by the University contributes an average of 136 tons of CO2 annually.
To help you think conscientiously about your choices, UNCG has an environmentally friendly purchasing policy, campus community education programs, and expanded recycling efforts that help reduce the amount of waste sent to landfills as well as reduce emissions from decomposition and embodied energy. All Multi-Functional Devices (MFD’s) on the Systel MPS program are set to default duplex printing to reduce paper use and expenses across campus. Sustainable products are featured first in our punch out catalogs in eMarketplace, one of which is TreeZero office paper that is in our Office Depot punch out catalog. This paper is made from sugar cane waste; previously such waste was burned and not used in any manner. The long term goal for materials management in the Climate Action Plan is for UNCG to become a zero-waste campus.
Purchasing Tips
- Is it durable and will it last a long time?
- Are raw materials being extracted to make it?
- Does it contain recycled content?
- Can it be recycled?
- What maintenance is offered / required?
- Does it save water?
- Does it save energy?
- Is it available in bulk?
- How far will it be shipped?
- Are there equivalent options with less packaging?
- Is it from a “Certified B Corporation”?
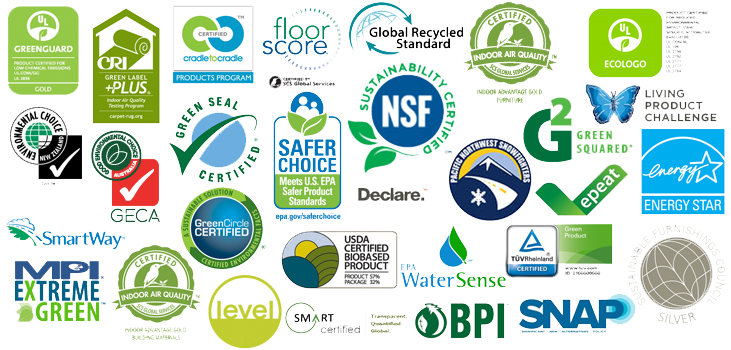
Look For These Logos
Additional Resources
Transportation
UNCG aims to provide multi-modal transportation infrastructure in a way that promotes sustainability, livability, and increases transportation choice to, from, and within our campus. In 2010, UNCG was the first employer in the Triad to be named to the Best Workplaces for Commuters list, “an innovative membership program that provides qualified employers with national recognition and an elite designation for offering outstanding commuter benefits, such as free or low-cost bus passes and vanpool fares and strong telework programs.” We followed that up in 2011, by becoming the first university in North Carolina to achieve a Bike Friendly University designation from the League of American Bicyclists, which “recognizes institutions of higher education for promoting and providing a more bikable campus for students, staff and visitors.”
Students and employees can bicycle through campus in dedicated lanes on Spring Garden Street that connect to the new Downtown Greenway, walk through the heart of campus along the College Avenue pedestrian mall, connect to Greensboro and the region by bus, or join a carpool club. Your participation in these “alternate” transportation methods helps limit traffic on campus and reduce UNCG’s carbon footprint, 30% of which is generated by single-occupancy commuter vehicles. We also have 23 electric vehicle charging stations on campus for commuters who drive EVs or hybrids.
Additional Resources
Waste
The university has an average overall landfill diversion rate of 37% and aims to become a zero-waste campus by 2050. Reduce, reuse, and recycle are stated in that order for a reason. While reusing and recycling are important, those actions deal with products near or at the end of their lifecycle. Every product we purchase went through an incredible energy intensive journey to reach the shelves in our stores, from the mining of natural resources, to the manufacturing process which often uses and wastes significant material in the refinement process, and the carbon intensive shipping transportation that is part of the global economy. Before we reuse and recycle, let’s give back to Mother Nature by taking a little less.
Reduce
- Distribute electronic versions of presentations and recurring news publications.
- Make use of electronic document software like Google Docs or Google Keep for note taking and sharing.
- Purchase items that contain at least 30% recycled-content.
- Buy products that use less (or no) packaging and recycle the packaging (if you can).
- Make “duplexing” or printing on both sides your default print and copy setting.
Reuse
Over 380 billion plastic bags and 60 billion single-use drinks are used every year in the United States. About 17 million barrels of oil are needed to create the bottles just used by Americans. Globally, humans buy a million plastic bottles a minute! Sadly, only about 7% of those bottles get recycled. Do you part to reduce plastic consumption – purchase a reusable water bottle and canvas bags. You’ll help the environment and your wallet!
- Buy reusable shopping bags, water bottles, and cloth napkins instead of paper towels.
- Use refillable ink cartridges, USB chargeable devices, rechargeable batteries.
- Shop at and donate items to local thrift stores.
- Keep your stuff as long as possible. “Retro” styles come around sooner than you think.
- Repair your stuff!
Recycle
UNCG recycles an average of 200 tons of commingled material annually. It’s important for our campus community to keep in mind that Greensboro has one of the highest recycling contamination rates in the nation and it’s an issue we have on campus too. Be sure to empty and clean your cups and containers before you put them in the recycling bin. As consumers, we’re an important factor in the circular economy.
Blue & green bins for commingled recycling can be found throughout campus. Drop-off locations for plastic bags, batteries, and ink cartridges in the lobbies of the Mossman, Moran Commons, and the Leonard J. Kaplan Center for Wellness buildings.
If you live off-campus within the Greensboro City Limits and have recycling in your place of residence download the GSO Collects app in the Google Play or Apple Store. Use the app’s Waste Wizard feature to learn if an item can be recycled or not – type in an item, like “coffee cup,” and it’ll tell you. There are some differences between what the City and UNCG collect, so be sure to study both recycling guides.
Litter
Litter has local and global ramifications. Greensboro’s stormwater system, like those of most cities, drains into our local creeks like Mile Run Creek to the south of campus and North Buffalo Creek, a tributary of which runs through Peabody Park. Those creeks are part of the Cape Fear River Basin, which drains into the Atlantic Ocean. Did you know that 80% of the plastic litter found in the oceans made its way there from the land? And pieces of plastic are easily mistaken for food by birds and fish here in Greensboro or hundreds of miles away in the ocean. It’s everyone’s job to pick up litter and keep campus and the environment clean. And when you graduate, skip the glitter, don’t litter.
Additional Resources
Water
Greensboro sits at the top of the Cape Fear River Basin in the Haw River Watershed, where small streams like the North Buffalo and Mile Run Creeks, which border UNCG to the north and south of campus, fill man-made reservoirs north of the city (Lake Higgins, Lake Brandt, Lake Jeanette, and Lake Townsend) from which residents get their drinking water. Water resources are projected to become scarcer as consumption grows in concert with the population of the Triad; droughts are also projected to be more frequent in the region due to the effects of climate change. Thanks to your efforts and to the work of dedicated staff, water consumption at UNCG has decreased by 78% per Gross Square Foot since 2003, far surpassing the 30% water savings goal established by the State. Your actions help conserve and preserve our drinking water and the local and regional habitats for thousands of flora and fauna.